COM3371 Communication Systems
McDaniel College Department of Communication
Richard W. Dillman (rdillman@ticopa.com)
SAMPLE SYSTEMS PROBLEM: GRADING IN COLLEGE COURSES
Perhaps the question I've been asked most often over my years as a teacher is "where did my grade come from?" It is hard to answer this question for any particular student, and almost impossible to answer it in a general way.
The reason is that problem of grading belongs to a large group of problems whose lable is: Subjective Judgement. Basically, the student does something and the teacher evaluates what the student does. The resulting evaluation is summarized as a letter "grade".
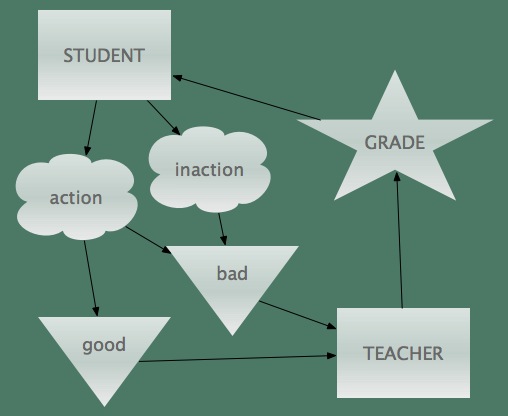
The grading process might be represented as a system model like this:
Grading Student Homework
Question:
Based on your own experience as a student, criticize this model. What changes might make the model more accurate? Be sure to provide evidence to justify your suggestions.
I will put parenthetical comments in red type. These are here to help you understand what I am doing, and they will not appear in the posted report.
Your answer will have to be posted to the discussion board. This means that you will need to use the board's formatting commands. I am using some of those commands here, and in the next post, which shows you what this would look like, you can see the results.
/center{/b{A BETTER MODEL FOR GRADING}} Every report needs a title. Use format codes to center it and make it bold.
R. W. Dillman The title is followed by some lines that identify the author and the date.
COM3371 Spring 2012
In a short report there is no need for an introduction. Start right in with your answer. Your answer might be different than what I've written here, of course. This is just an example to show you how to organize and format your results.
The diagram says that a teacher sees a student's action or inaction, and the student sees a grade. This seems to be from the point of view of the teacher. It leaves out the assignment ... which is actually the first thing that the student sees.
The assignment may be clear or confusing ... and the work to be done may be difficult or easy. The effort that the student puts in may have as much to do with the quality of the assignment as with the student's intentions.
Also, the teacher does not really \i{see} use the format code for italics the student's action or inaction. Instead, the teacher sees what the student hands in and then infers that the student was active or inactive.
So, the diagram needs to show the assignment itself and how it interacts with the teacher and student. And it needs to show the final product. A more accurate diagram might look like this.
\image{Grading Student Homework} This formatting command will cause your computer to ask you to find the file that must be uploaded. The file must be a .jpg or .gif image file, and it must be small enough for the discussion board to accept it. If an image is rejected for being too large, then use your graphics software to reduce the number of pixels it has, and then try to upload it again.
You are not required to upload charts to the discussion board. However, there are many times when a chart will save you having to write hundreds of words of descriptions. So I would urge you to use them.
Your computer may already have a charting program on it. Excel, for example, can make some kinds of charts. And some computers include a basic flowcharting program in the free stuff that comes with the computer.
Here is a link to a review of some free flowcharting software: <http://www.webgrrls.com/blog/2008/08/28/free-flowcharting-software-alternatives/>. You can find more by searching on "free flowcharting software".
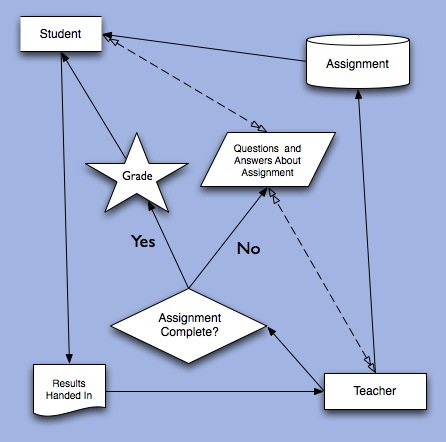
This image was made on my Mac computer using OmniGraffle ... a program for making flowcharts, and saved as a .jpg file for uploading.
In this diagram the teacher gives an assignment, which is then discussed with the student. The student hands in his or her results. If these are not satisfactory, then the teacher and student discuss the assignment some more. When the results are sufficient (or if time runs out), then the teacher gives the student a grade for the assignment.
This model is better because the grade no longer depends on the teacher's judgement of how much the student worked, but rather on the teacher's evaluation of the final product.
And that's it. The report is very short because the diagram does much of the talking. Notice that I use very short paragraphs. This is standard when writing for posts or web display ... because long paragraphs are very hard to read on a screen.
I do not care about the report's length. But I do care that you have something to say, and that you show me that you, personally, understand what you have been reading about and discussing online.
You "hand in" your report by posting it to your personal thread on the class discussion board. I will download it to my home computer, save it as a .pdf file, grade it using Adobe Acrobat, and email the graded report back to you. I do it this way ... rather than just grading your online post ... to provide privacy and confidentiality with your grade. Your computer needs Adobe Reader in order to see my comments, but both Macs and PCs have this software on board nowadays.